

Recap: AAPL, CEG + TEM

That quote—“The market is a device for transferring money from the impatient to the patient”—really gets to the heart of what separates successful traders and investors from the rest. Whether Warren Buffett actually said it or not, the sentiment rings true. The market doesn’t reward frantic moves or knee-jerk reactions. In fact, it often punishes them.
read the full post here →
[You can find the original watchlist post here →]
I thought the quote was timely as we review $AAPL’s results. Apple is a stalwart in the trading community—a ticker you can count on to do what it’s supposed to do.
That’s saying a lot for any stock in the public markets, but Apple has earned its reputation. It is the quintessential example of a steady, reliable stock.
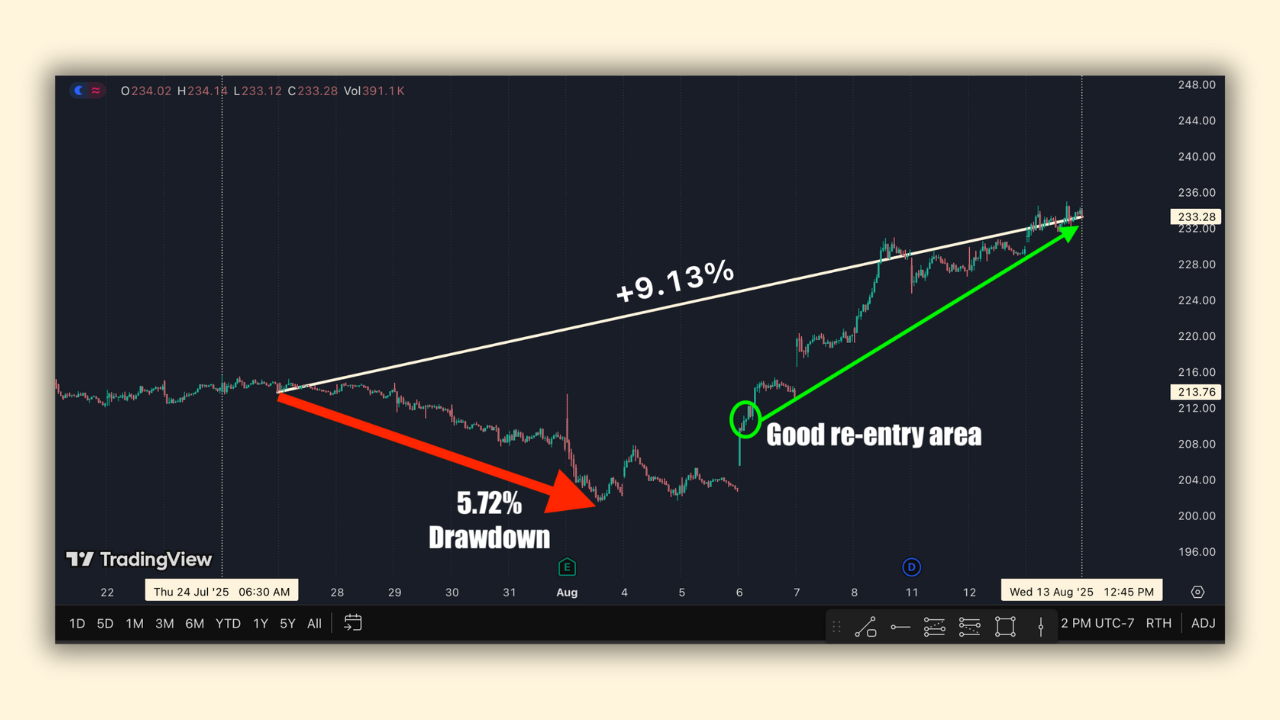
With that in mind, some entered $AAPL on July 24th and held through a tough 5.72% drop right after getting in.
Did you jump in right away? Did you hold through the turbulence? Did you curse Apple? Did you curse me? Maybe you joked, “This seasonality stuff is as fake as an EyePhone made in Russia.” Or did you, as a seasoned trader, wait patiently and enter when the chart and market gave you the signal?
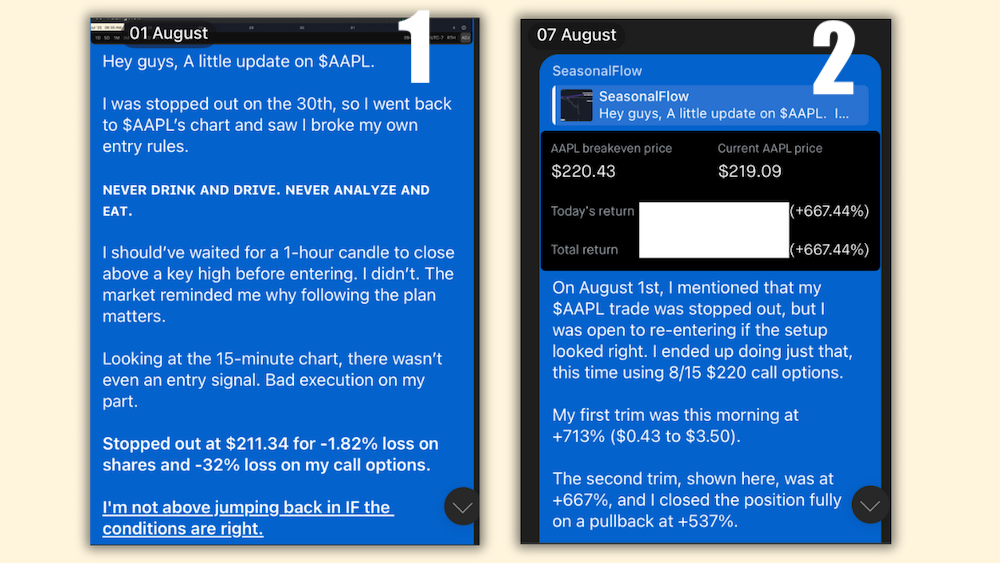
For my part, I got in early, got stopped out, re-entered on August 6th, trimmed on the way up, and got stopped out for a hefty gain.
Bottom Line
AAPL delivered an impressive +9.13% gain from July 24th to August 13th, closing the trade at 233.33 after starting at 213.76.
The ride had its bumps: an early dip, a sharp earnings spike, and a quick pullback before news of big U.S. manufacturing investments gave the stock a second wind. After the ex-div date on the 11th, AAPL kept climbing, though the pace cooled off.
Entering and exiting at the close of each window bagged the full gain, while the low-to-high swing hit +16.63%—with the biggest drawdown at 5.8%. Beating the (+4.07%) average by a mile, this trade was a clear win.
Hats off to anyone who booked profits.
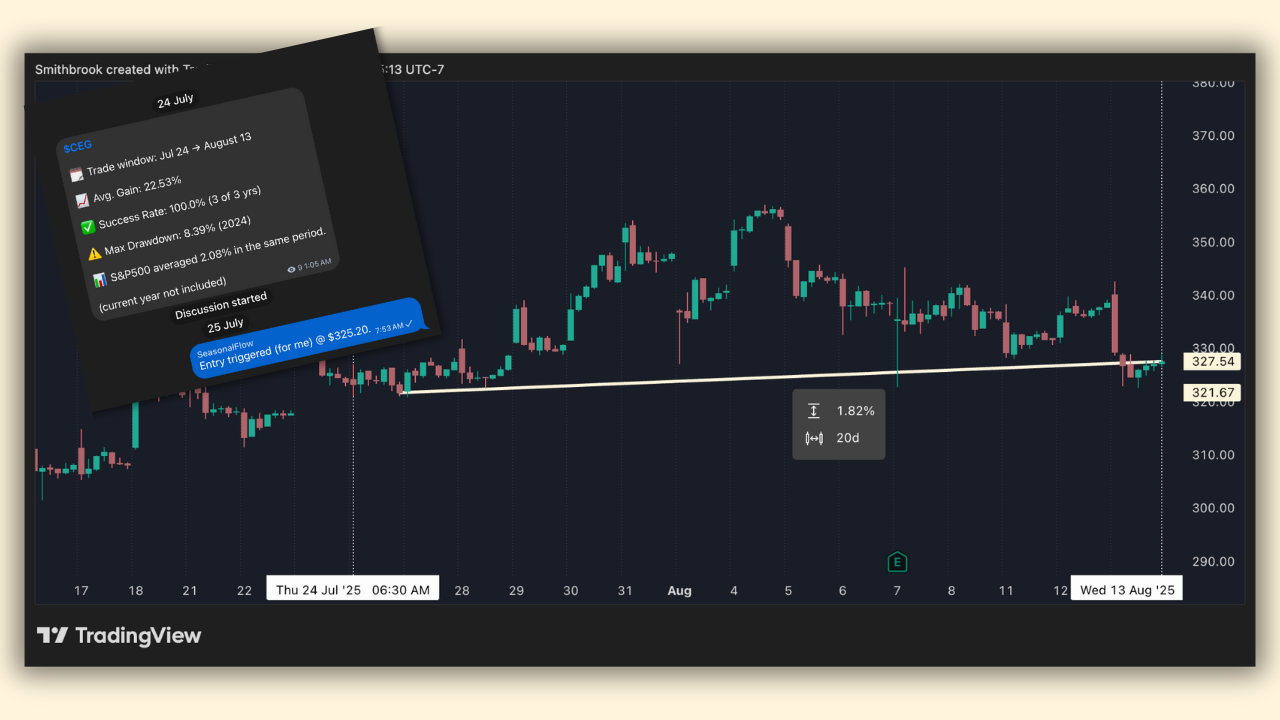
$CEG picked up a modest 1.82% gain from July 24 to August 13, well below the 22.53% average from past years. The stock teased a +10.98% high after entry and never dropped more than 0.5%, so risk was low.
With only three years of seasonal data, this setup was more “meh” than marvelous—sometimes history alone doesn’t cut it.
As my brother says about the Mets and Knicks, "a win is a win". But (to me), how you play still matters, so in this instance, both sides get a point.
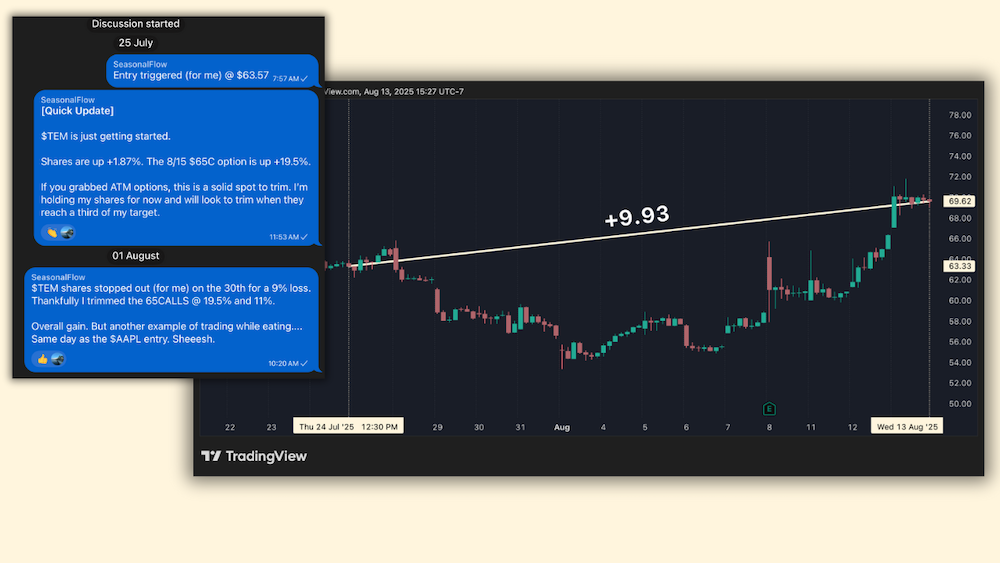
Lastly, there was $TEM, which closed the July 24 to August 13 trade window with a solid +9.93% gain, even though it missed the 12.09% average. The journey wasn’t for the faint of heart, with a stomach-churning 15.7% drawdown along the way.
Savvy traders who bought near the swing lows could have bagged up to a +34.5% move, but let’s be honest—most of us didn’t. If you managed to capture even a slice of that run, you’ve got every reason to feel like a fat cat.
Three tickers, three different stories—sometimes the market hands you a win, sometimes just a lesson. If you walked away with gains or simply some wisdom, that’s a victory either way. Keep your eyes on the charts, and remember: patience pays.

Discussion